
The future users of the built environment will include a wide range of autonmous agents, such as servicing robots and autonomous wheelchairs. This research investigates effects of common building materials on the Light Detection and Ranging (LiDAR) device to provide guidance for the development of autonomous/robotic-friendly environments. The LiDAR is used commonly in autonomous vehicles for navigation and collision detection.
The results of this study demonstrate how various materials (particularity glass) provide missing or inaccurate data (measurements) leading to potentially dangerous situations in the context of indoor autonomous mobility. Finally, the research proposes techniques and ideas helping designers to develop new materials with autonomous vehicle friendly characteristics.
Researchers+paper authors: Mathew Schwartz (NJIT) and Andrzej Zarzycki (NJIT). This research was published at eCAADe 2017 conference: CuminCAD paper link or Academia.edu repository page.
Video of the experiment setup and testing
Materials
Multiple samples of base measurements and architectural glass were used in the experiment. Nine glass samples, two plastic samples, a steel perforated
plate, clear glass, opaque plastic, and a cardboard material were used.
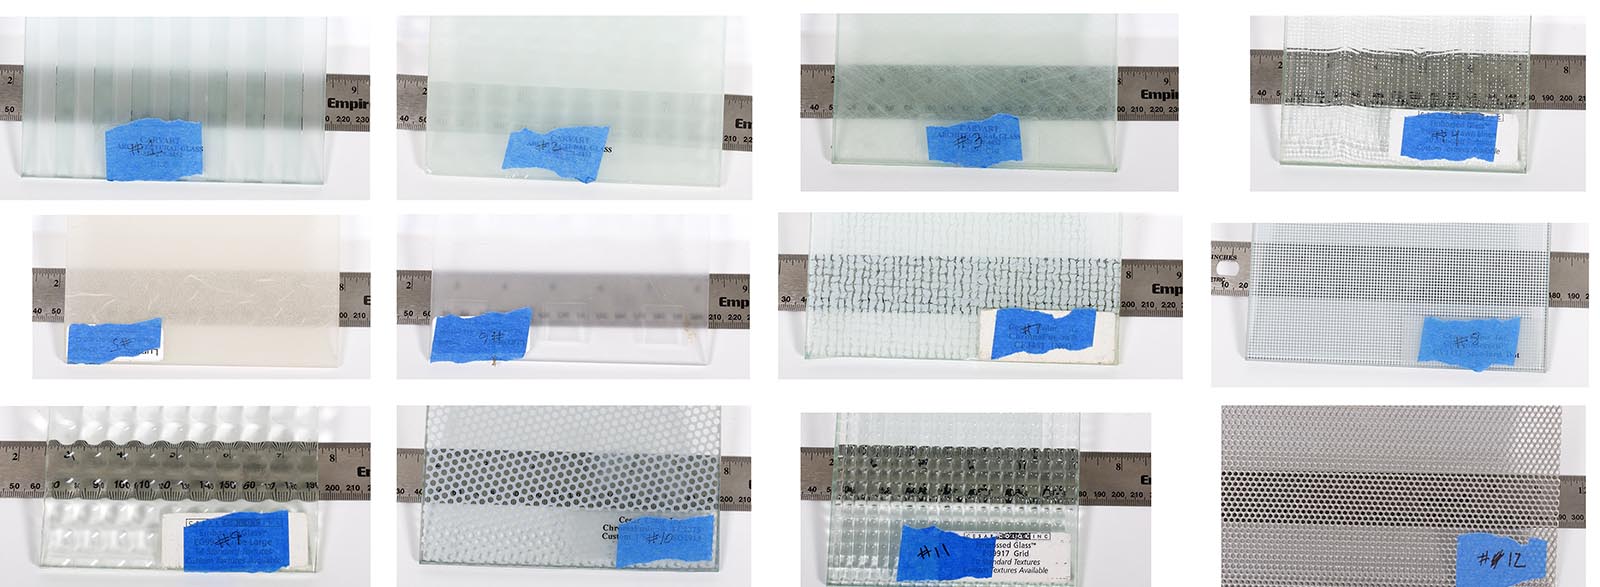
Material samples used in LiDAR testing
Experiment
The hardware setup (figures below) consists of a Ø12 mm lead screw with an anti-backlash nut, a 12 V 1.4-amp Nema 17 stepper motor, an Arduino Uno, and
a TB6600 motor driver with 1/16 micro-stepping enabled. A basic program for controlling the motor and receiving LIDAR data through serial communication
was implemented on the Arduino. Python programming language with the pySerial module was used to send and receive data with the Arduino.
Three measurement positions were installed with brackets on the baseboard: (1) a distance of 55 cm from the LIDAR at a 90-degree angle (perpendicular
to the LIDAR ray), (2) 106 cm from the LIDAR at 90 degrees, and (3) 106 cm from the LIDAR with a 45-degree angle

Testing hardware setup
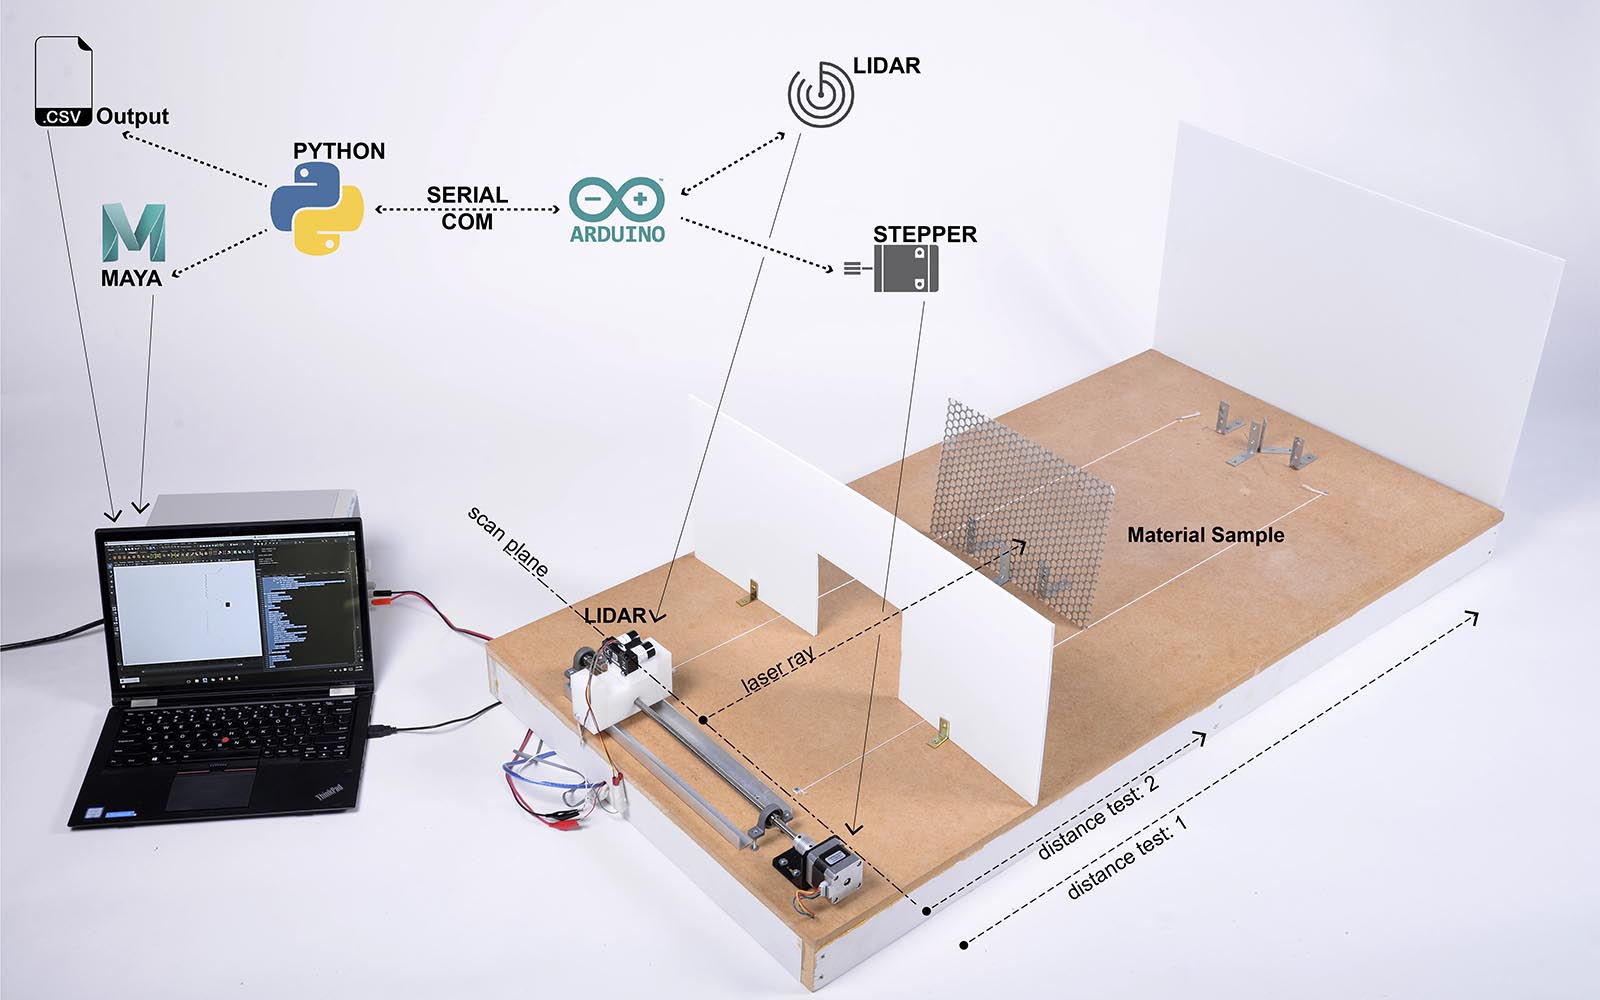
Diagram of the research experiment setup and production pipeline
Data and Analysis
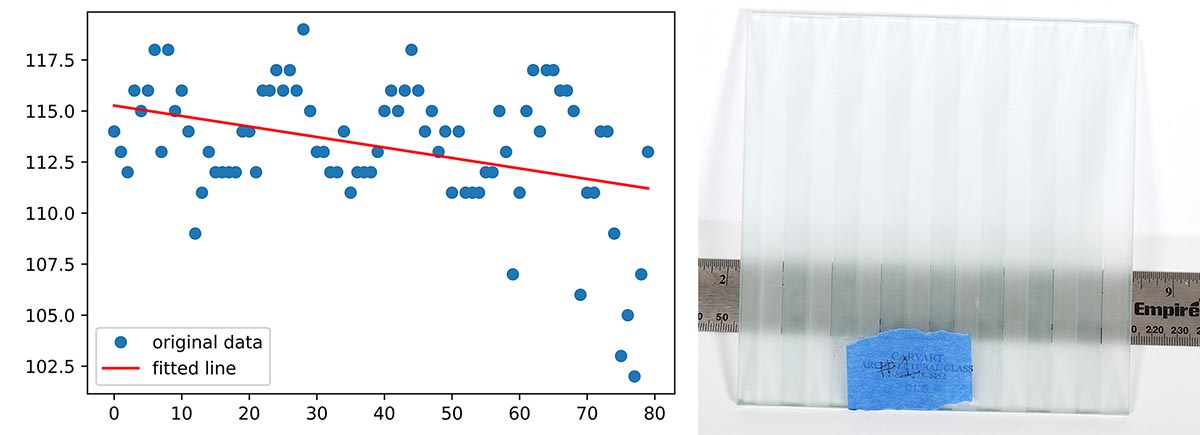
Sample 1 data set at 106 cm perpendicular to the LIDAR (left). Pattern on the sample 1 glass. Data points reflect the surface topology of the glass sample
The experiment was conducted multiple times to validate consistency (the level of errors) between each pass. The diagram below show each pass separately.

Multiple passes/tests show convergence of results.
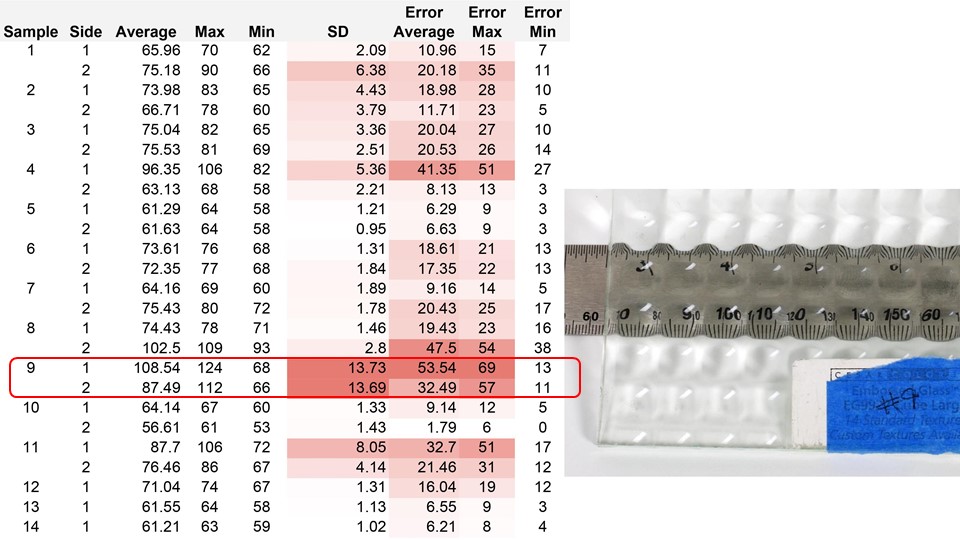
Results from a 55cm perpendicular sample. Sample numbers correspond to the specific names described in the methodology. Both sides of the samples were tested. The average, maximum, minimum, and standard deviations of the data are displayed, followed by the average, maximum, and minimum errors from the actual distance. Color gradient from white to red , where red is the highest value per column. Sample 9 shows very high levels of errors due to the ‘lens-like’ topology of the glass surface.
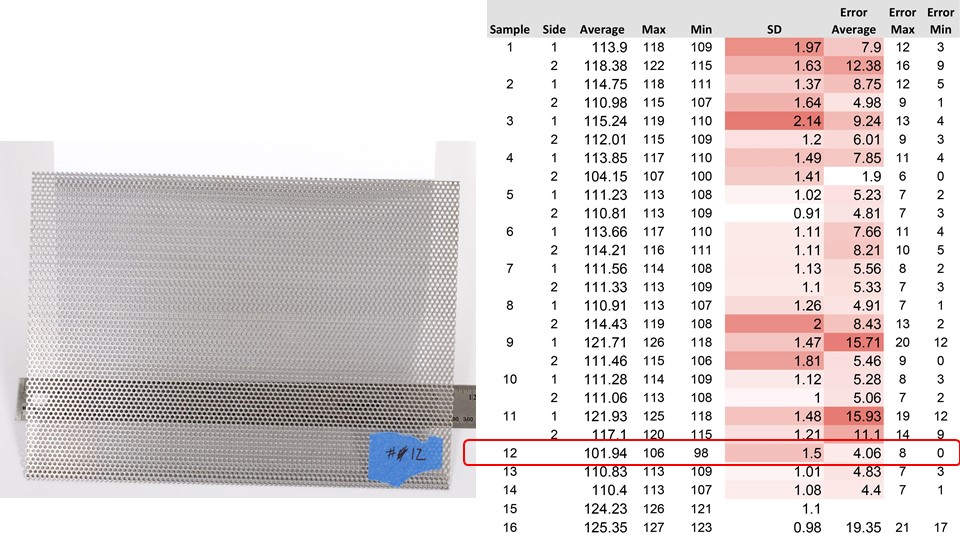
This table shows the results from a 106 cm perpendicular sample. Sample 15 is the backplate, and sample 16 is clear glass. Color gradient from white to red , where red is the highest value per column. Sample 12–perforated steel–provides good reading surface for LiDAR due to small openings